Features
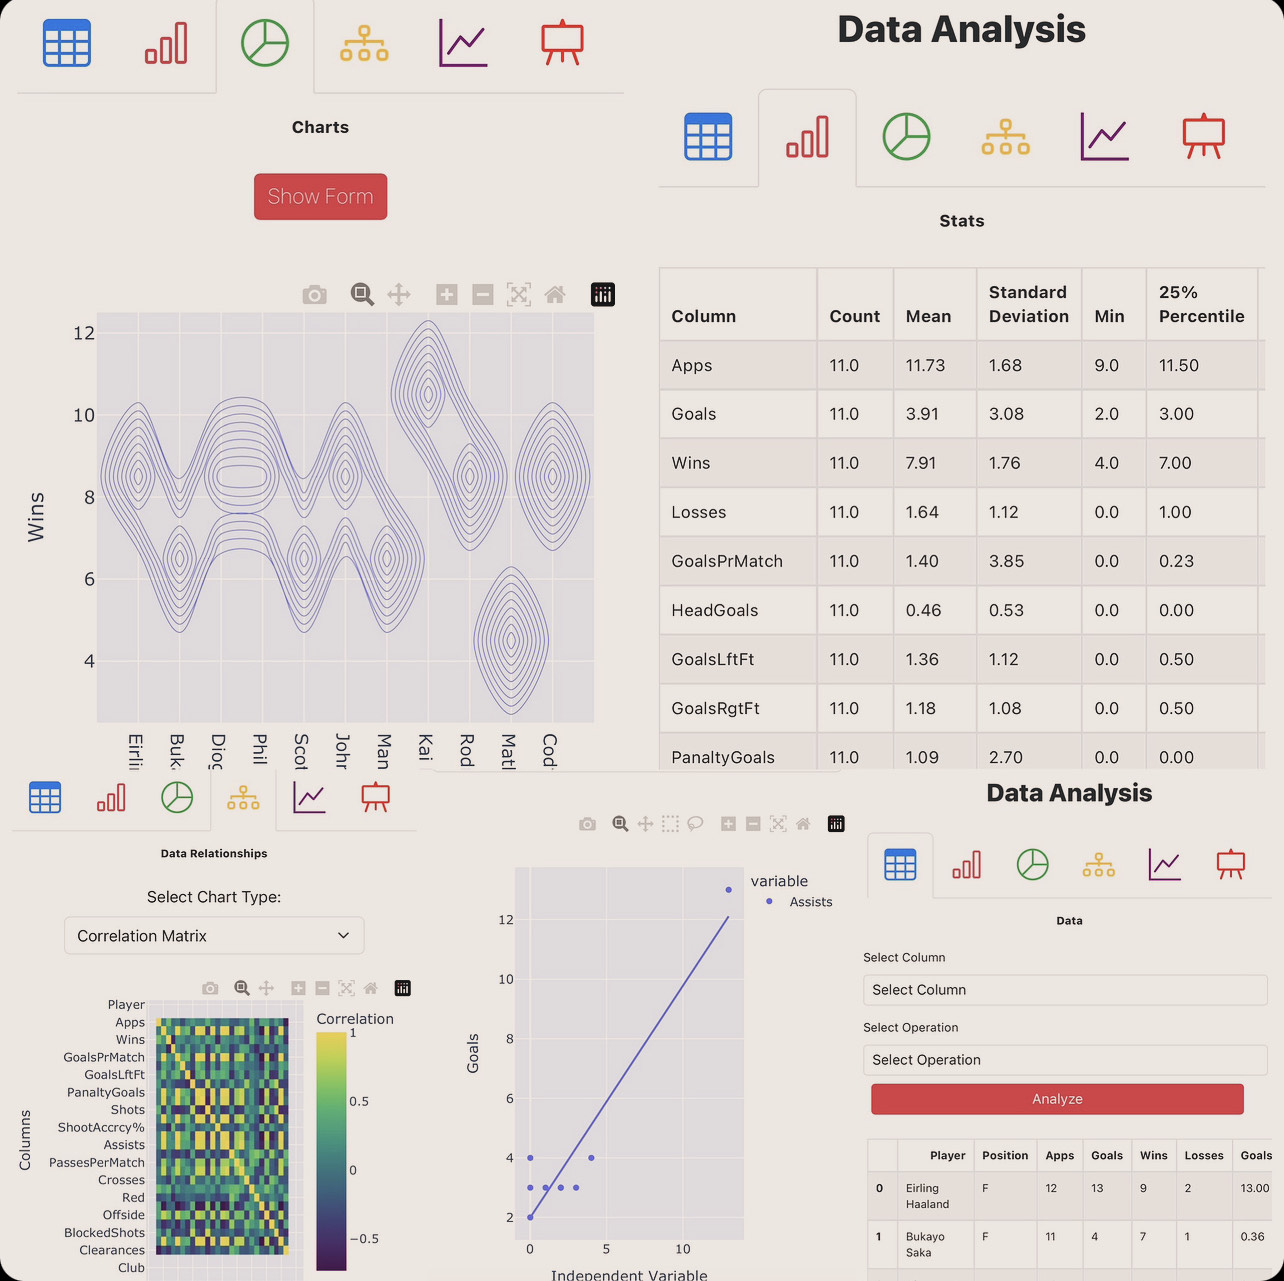
User friendly data analysis platform, allows you to build all types of charts, analysis, stats, and machine learning models for prediction.

Discover cutting-edge solutions powered by AI and machine learning that your business can benefit from.
Identify objects, faces, and scenes in images with high accuracy.
Forecast trends and make data-driven decisions for your business.
Analyze and understand text with advanced NLP techniques.
Analyze temporal data for forecasting and trend detection.
Interested in leveraging machine learning for your business? We'll work with you to create a customized plan and explore the best ways to bring the power of ML to your business.
Fill out the form below to let us know your requirements. We understand that machine learning models might not be the right fit for everyone, so feel free to contact us for a free consultation.
User friendly data analysis platform, allows you to build all types of charts, analysis, stats, and machine learning models for prediction.

For small business inventory, sales or other data, several types of machine learning (ML) models can be built to optimize operations, improve decision-making, and forecast future demand. The specific type of ML model depends on the goals of the business and the available data.
Here are some common use cases and ML models that can be built using inventory data:
Use Case: Predict future demand for products to optimize stock levels and reduce overstock or stockouts.
Data Needed: Historical inventory levels, sales data, seasonality, promotions, and other time-dependent factors.
Example: Predicting how much of each product will be needed in the next month or quarter.
| Date | Product | Units Sold | Price | Promotion |
|---|---|---|---|---|
| 2023-01-01 | Product A | 150 | 10.5 | No |
| 2023-01-02 | Product A | 170 | 10.5 | Yes |
| 2023-01-03 | Product A | 160 | 10.5 | No |
| 2023-01-04 | Product A | 180 | 10.0 | No |
Use Case: Optimize the inventory levels by predicting the ideal stock quantities for each product based on demand and other factors.
Data Needed: Inventory levels, sales, delivery times, costs, storage limits, and demand patterns.
Example: Recommending optimal reorder quantities and reorder points for each product to avoid stockouts.
| Product ID | Product Name | Category | Unit Cost | Selling Price | Historical Demand | Current Inventory | Reorder Point | Lead Time | Holding Cost | Shortage Cost | Ordering Cost |
|---|---|---|---|---|---|---|---|---|---|---|---|
| 1 | Tennis Racket | Sports | 50 | 100 | 200 | 30 | 10 | 20 | 5 | 2 | 10 |
| 2 | Tennis Ball | Sports | 2 | 5 | 1000 | 500 | 200 | 2 | 1 | 0.5 | 2 |
| 3 | Tennis Shoes | Sports | 40 | 80 | 300 | 20 | 10 | 7 | 3 | 2 | 8 |
Use Case: Identify and categorize images into predefined categories based on visual content.
Data Needed: Labeled images for each category, including examples with different lighting, angles, and backgrounds.
Example: Automatically classifying product images by category (e.g., clothing, electronics) to streamline cataloging for an e-commerce platform.
| Image ID | Category | Resolution | File Size (KB) | Format | Color Mode | Aspect Ratio | Brightness Level | Contrast Level | Tags | Source | Upload Date |
|---|---|---|---|---|---|---|---|---|---|---|---|
| 1 | Clothing | 1920x1080 | 450 | JPEG | RGB | 16:9 | Medium | High | Shirts|Summer|Fashion | User Upload | 2023-07-15 |
| 2 | Electronics | 1280x720 | 300 | PNG | Grayscale | 4:3 | Low | Medium | Phone|Gadget|Mobile | Online Catalog | 2023-06-10 |
| 3 | Home | 1024x1024 | 500 | JPEG | RGB | 1:1 | High | Low | Furniture|Interior|Modern | In-house Photography | 2023-05-05 |
| 4 | Sports | 800x600 | 200 | JPEG | RGB | 4:3 | Medium | High | Football|Outdoors|Active | User Upload | 2023-08-22 |
| 5 | Clothing | 1920x1080 | 480 | PNG | RGB | 16:9 | High | Medium | Jackets|Winter|Fashion | Online Catalog | 2023-09-10 |
Use Case: Segment customers based on purchase behavior, which helps with targeted promotions and stocking relevant products.
Data Needed: Customer purchase history, demographics, and transaction frequency.
Example: Grouping customers into categories such as "frequent buyers" or "seasonal buyers" to adjust inventory levels for specific groups.
| Customer ID | Age | Gender | Location | Income Level | Marital Status | Total Spend | Purchase Frequency | Average Order Value | Recency | Website Activity | Product Categories | Purchases Channel | Loyalty Points |
|---|---|---|---|---|---|---|---|---|---|---|---|---|---|
| 1 | 25 | Female | New York | 60,000 | Single | 1,500 | 10 | 150 | 30 | 5 | Clothing|Electronics | Online | 200 |
| 2 | 35 | Male | Los Angeles | 80,000 | Married | 3,000 | 8 | 375 | 15 | 10 | Sports|Clothing | In-Store | 150 |
| 3 | 45 | Female | Chicago | 75,000 | Married | 2,500 | 12 | 208.33 | 7 | 8 | Electronics|Home|Clothing | Online | 300 |
| 4 | 30 | Male | Houston | 50,000 | Single | 1,200 | 5 | 240 | 60 | 6 | Sports | Online | 100 |
| 5 | 40 | Female | Phoenix | 90,000 | Married | 4,500 | 15 | 300 | 10 | 12 | Home|Electronics | In-Store | 400 |